Glitch Explorer
For the older V3.x tools, see V3:Glitch_Explorer
This page is under construction
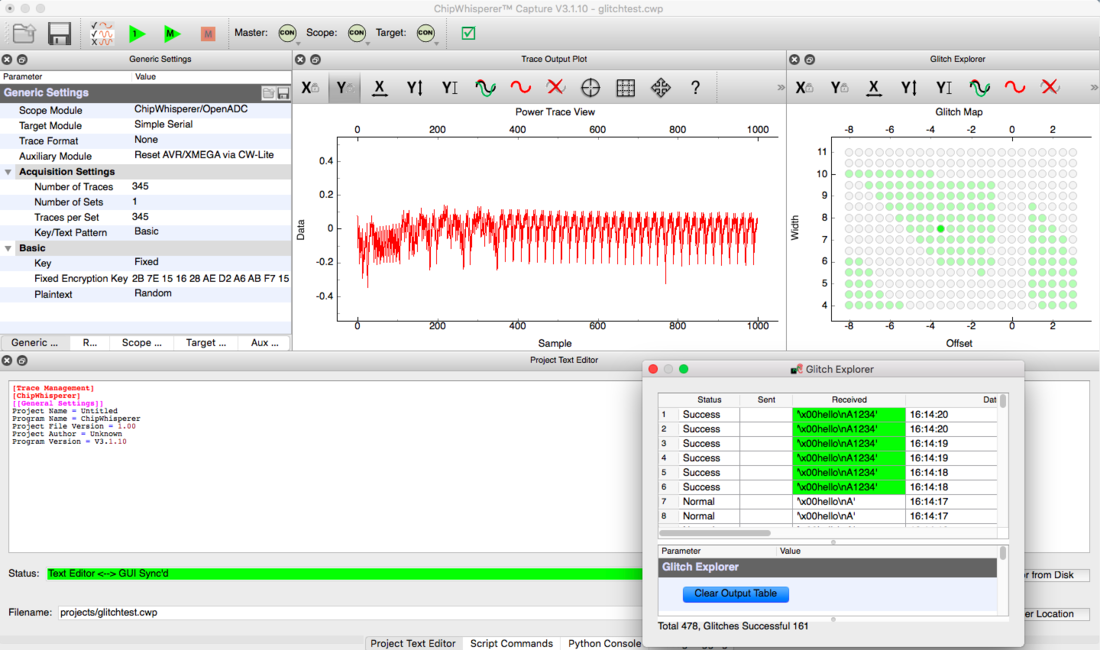
The Glitch Explorer allows an automatic exploration of a range of one or more parameter values. It means that the user can test multiple glitch setups at the same time and see the result in a nice scatterplot, highlighting the successful attempts.
The Glitch Explorer Window
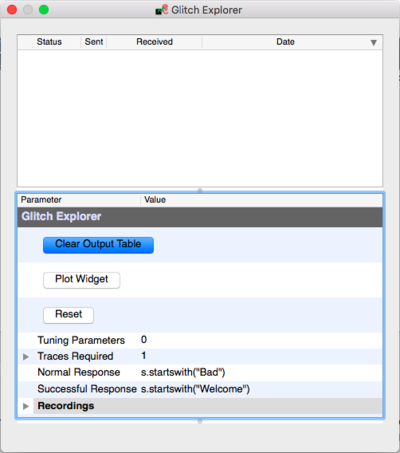
The main window of the glitch explorer looks like this:
In top, the output of the system combined with the parameters of the glitch is displayed (the 'output window').
In bottom, you can adjust general parameters of the glitching system, such as what counts as a successful glitch or not and how many parameters to fiddle with.
Using the Glitch Explorer - The Basic
To start using the Glitch Explorer, you should first switch to the "Target Settings" tab and set the "Output Format" to be $GLITCH$. This will mean data is no longer sent to the terminal emulator when using the capture 1 or capture M buttons, but instead, is logged in the glitch explorer window.
Then, you should define what is a Normal and a Successful Response. This information is used to highlight the individual attacks. You should use Python expressions here, where 's' is a str-type variable which contains the response of the system (ex.: s.endswith("123456")).
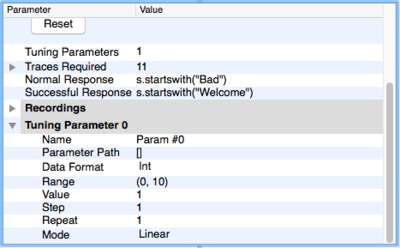
The next step is to set the number of tuning parameters. You may want to start with 1 (0 is used to just record manual exploration attempts in the table) and then increment it to 2 or more later. This will generate another group in the list where you can tune the settings for each parameter:
- Name - is just a reminder of what we are tuning.
- Parameter Path - defines what will be modified. This string can simply be copied from the Script Commands, provided that you remove the last element first (which is the value).
- Data Format - defines what type of data will be inserted into the parameter.
- Range - defines the range from the minimum to maximum that will be swept for the parameter.
- Value - defines the current/start value of the sweep. This is NOT automatically set to the minimum value of your sweep since you may want to stop and continue later or attack a smaller number of traces. If you want to perform the full sweep, you must manually set this to the minimum of the range or click reset.
- Step - defines the incremented on each glitch attempt. When the value reaches the maximum defined by the range, it will loop around to the minimum and continue incrementing.
- Repeat - defines how many times to perform the same value. This can be used to determine the reliability of each glitch value.
The last step is to set the "Generic Settings"->"Acquisition Settings"->"Number of Traces" to a value high enough to loop trough all the value combinations. It can be performed automatically clicking in the "Glitch Explorer"->"Traces Required"->"Use this value" button.
Now you are ready to click the "Capture M" to start the exploration.


